![]()
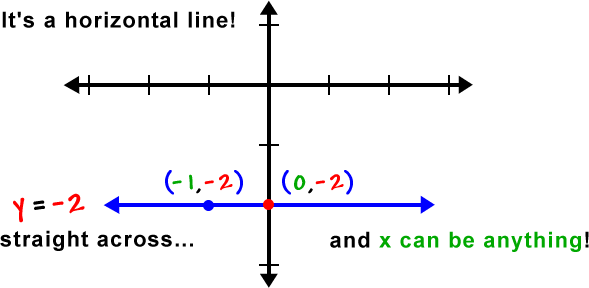
Hmm... It doesn't look like there's enough there!
Where's the x? We're used to these:

Well, here's the deal:
If the x isn't there, then it can be anything!
And y is locked in at -2.
So, what would this
look like?
So, what's the slope of this line? Grab two points and see?
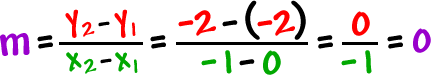
The slope of a horizontal line is 0!
Since it's always hard to remember when these guys are horizontal and when they are vertical, I've got a sentence that will always save you...
When you see y = -2, say this:
|
y is always -2 and x can be anything! |
This tells you what the graph should look like!
TRY IT:
| Graph |
|
... Then, grab two points and find the slope.