First, let's do a quick review of graphing line inequalities:

Let's graph

x + y is less than or equal to 3

Graphing the line, itself, should be a no-brainer for you...  But, figuring out which side should be shaded is often the snag.

Here's the line:
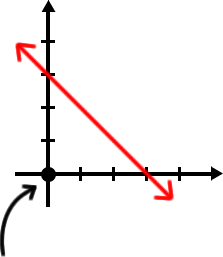
the graph of x + y = 3 ... choose the test point ( 0 , 0 ) The line is solid because of the " = " in the less than or equal to ...

So... what side gets shaded?

To figure this out, we just pick a point that is NOT on the line and see if it works in

x + y is less than or equal to 3

Let's try (0, 0) since it's so easy to work with:
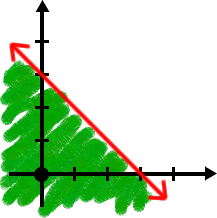
graph of x + y is less than or equal to 3 ... the portion of the graph below the line is shaded x + y is less than or equal to 3

0 + 0 is less than or equal to 3 ... Is this true?  Yep!

If (0, 0) works, then everything on his side of the line will work --
So, shade that side!  If it didn't work, then we'd shade the other.


YOUR TURN:

Graph y is greater than or equal to 2x - 3