SOME GRAPHICAL EXAMPLES:
On the previous page, we saw what happened to the sequence whose nth term is given by 1/n as n approaches infinity... The terms 1/n approached 0.
Now, let's look at the graph of f(x)=1/x and see what happens!

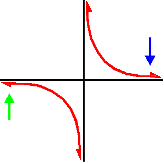
The x-axis is a horizontal asymptote... Let's look at the blue arrow first. As x gets really, really big, the graph gets closer and closer to the x-axis which has a height of 0. So, as x approaches infinity, f(x) is approaching 0. This is called alimit at infinity.

Now let's look at the green arrow... What is happening to the graph as x gets really, really small? Yep, the graph is again getting closer and closer to the x-axis (which is 0.) It's just coming in from below this time.

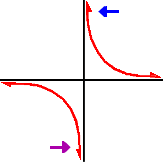
But what happens as x approaches 0?

Since different things happen, we need to look at two separate cases: what happens as x approaches 0 from the left and at what happens as x approaches 0 from the right:
 | and |  |
Since the limit from the left does not equal the limit from the right...
