There are two efficient and accepted methods for graphing lines -- this is one of them. For the other one, we'll need some more ammunition, so I'll save it for later. You WILL need to master both.
On to method 1... First of all, you'll need to know what an intercept is!
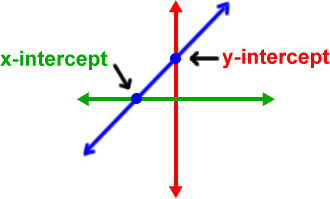
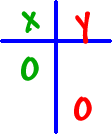
The intercepts are where a graph crosses the x and y axes.
Not only are these the easiest points to find, as you'll see later in math, they are the most important points.
Here's how this works... Let's graph
![]()
|
Make an xy table:
|
[[{"fid":"1806","view_mode":"default","fields":{"format":"default","field_file_image_alt_text[und][0][value]":"","field_file_image_title_text[und][0][value]":""},"type":"media","attributes":{"class":"media-element file-default"}}]][[{"fid":"1806","view_mode":"default","fields":{"format":"default","field_file_image_alt_text[und][0][value]":"","field_file_image_title_text[und][0][value]":""},"type":"media","attributes":{"class":"media-element file-default"}}]][[{"fid":"1806","view_mode":"default","fields":{"format":"default","field_file_image_alt_text[und][0][value]":"","field_file_image_title_text[und][0][value]":""},"type":"media","attributes":{"class":"media-element file-default"}}]][[{"fid":"1806","view_mode":"default","fields":{"format":"default","field_file_image_alt_text[und][0][value]":"","field_file_image_title_text[und][0][value]":""},"type":"media","attributes":{"class":"media-element file-default"}}]][[{"fid":"1806","view_mode":"default","fields":{"format":"default","field_file_image_alt_text[und][0][value]":"","field_file_image_title_text[und][0][value]":""},"type":"media","attributes":{"class":"media-element file-default"}}]][[{"fid":"1806","view_mode":"default","fields":{"format":"default","field_file_image_alt_text[und][0][value]":"","field_file_image_title_text[und][0][value]":""},"type":"media","attributes":{"class":"media-element file-default"}}]][[{"fid":"1806","view_mode":"default","fields":{"format":"default","field_file_image_alt_text[und][0][value]":"","field_file_image_title_text[und][0][value]":""},"type":"media","attributes":{"class":"media-element file-default"}}]][[{"fid":"1806","view_mode":"default","fields":{"format":"default","field_file_image_alt_text[und][0][value]":"","field_file_image_title_text[und][0][value]":""},"type":"media","attributes":{"class":"media-element file-default"}}]][[{"fid":"1806","view_mode":"default","fields":{"format":"default","field_file_image_alt_text[und][0][value]":"","field_file_image_title_text[und][0][value]":""},"type":"media","attributes":{"class":"media-element file-default"}}]] |
Fill in 0's for the
|