To get the picture of an inverse, you just take the mirror image over the line y = x.

basic graph of an exponentialthe graph of an inverse is just the mirror image over y = x


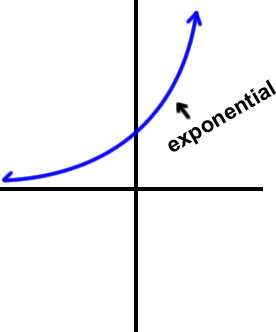
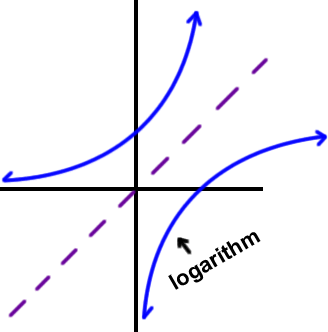
So, the standard graph for a logarithm with a base that's > 1 is

the basic shape of the graph f( x ) = -a^x  ...  the y-axis is a vertical symptote  ...  as x gets bigger, the graph climbs slowly


TRY IT: 

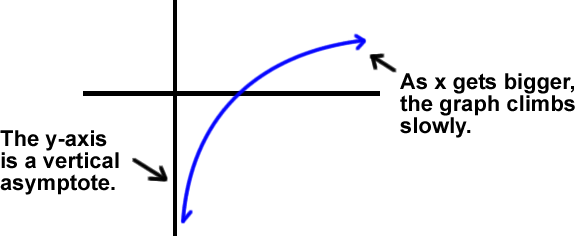
Draw a rough sketch of f( x ) = log( x ) and label
the tail behavior as x --> infinity and x --> 0 from the right .