Let's do another one:
| Graph |
| 2 things |
| The y-intercept: Find f(0) |
|
| The x-intercept: numerator = 0, solve |
|
|
| Vertical asymptotes: denominator = 0, solve |
|
|
| Horizontal asymptote: |
Look at |
|
|
*When this is the case, we're going to be forced to "quickie plot" a few points to nail the graph. No, this is not being a sissy -- we'll have no choice. Calculus will take care of this though!
OK, let's start graphing!
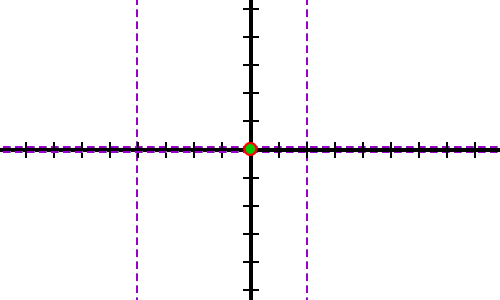
Let's get our intercepts and asymptotes down:

Since we've got that pesky y = 0 horizontal asymptote, we can't use our "nowhere else" info on the x-intercepts to figure out the "upstairs" or "downstairs" stuff. Until we have Calculus, we're going to have to humble ourselves and plot some points -- kind of! We're going to avoid taking that pathetic trip to Sissyville by cheating a little bit... I call it "quickie plotting."
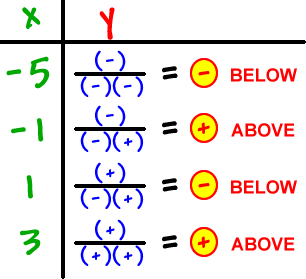
Four strategically located points will do it and all we really need to know is if he's above or below the x-axis at each point.
We'll be plugging x's into the factored form:
| *We only care about positives and negatives -- see if you can do it! |
|
|
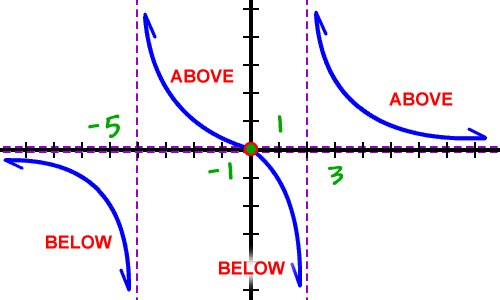
Now we've got it!
| *Remember that he can only cross the x-axis at x = 0... So, once he's below, he'll be stuck there... and, once he's above, he'll have to stay above! |

YOUR TURN:
| Graph |
| (You already have all the pieces!) |
*Remember that, when you are working these things out -- write out all of your work in a neat and organized way! This is one of the main reasons you have to take math classes -- they teach you to organize your thoughts AND TO THINK!


