Up till now, we've been graphing things like

y = x^2

y = 3x - 5

y = -2 | x - 1 |

Now, we're going to graph something that comes in more than one chunk.  You'll see.

Let's just dive in and do one:

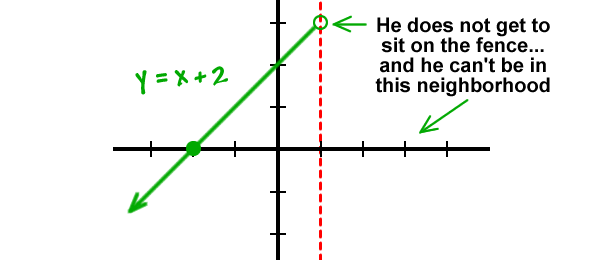
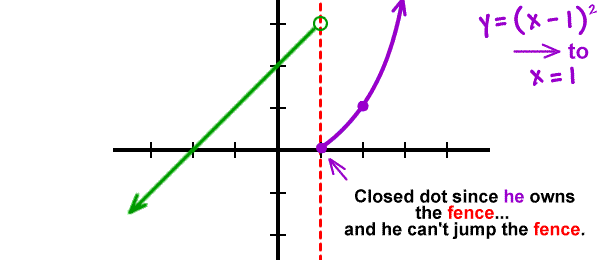
Graph y = x + 2 for x < 1 and y = ( x - 1 )^2 for x is greater than or equal to 1 ... It's in two pieces!

Each piece must live ONLY in its own neighborhood.

Let's put up a fence, so we don't make any mistakes:
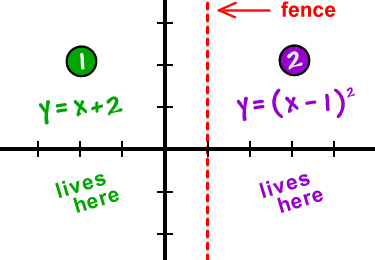
Put up a fence at x = 1 ... y = x + 2 lives on the left side, y = ( x - 1 )^2 lives on the right side

Now, we just need to figure out who the fence owner is...

y = x + 2 for x < 1 and y = ( x - 1 )^2 for x is greater than or equal to 1 ... the second guy has the "=", so he gets to live ON the fence.

Let's graph part1:

graph of y = x + 2 on the left side of the fence ... he does not get to sit on the fence... and he can't be in the neighborhood on the right

Let's graph part2:

graph of y = ( x - 1 )^2 on the right side of the fence ... parabola shifted right to x = 1 ... closed dot since he owns the fence... and he can't jump the fence

Done!


TRY ONE:

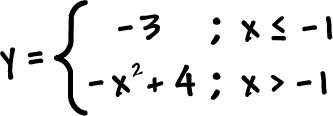
Graph  y = -3 for x is less than or equal to -1 and y = -x^2 + 4 for x > -1