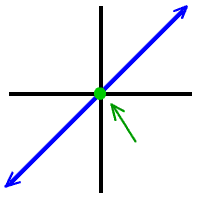
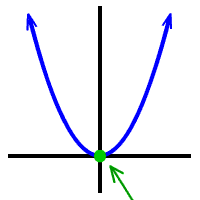
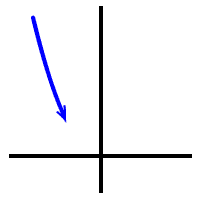
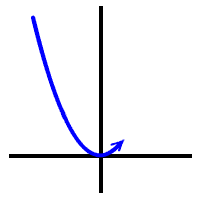
OK, check out these graphs...
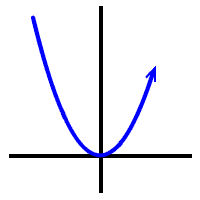
Look at HOW they hit the x-axis...
|
|
|
|
|
|
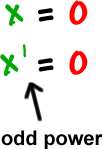
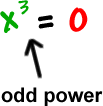
The first one and the last one are what I call "shoot throughs." They shoot through the x-axis.
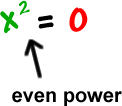
The middle guy "kisses" the x-axis:
|
|
|
It comes in... | kisses... | then goes away. |
Notice what happens when we get the zeros...
|
|
|
| *When the power on a zero is odd, it's a shoot through. *When the power on a zero is even, it's a kiss. |
