(The black and white graphs are screen captures from a TI-92 graphing calculator. The other graphical images are screen captures from the digital editing software SAW Plus.)
What are damping functions?
The best way to explain them is to show you some examples...
Look at the function f(x) = x*sin(10x). (The * is being used to indicate multiplication.)
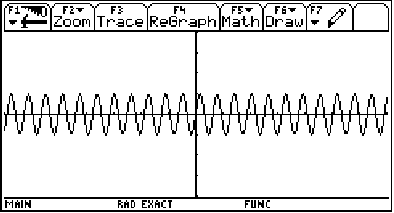
Ignoring the first factor, x, for a minute, the graph of g(x) = sin(10x)looks like:

(graphing window: x on [-7,7], y on [-4,4])
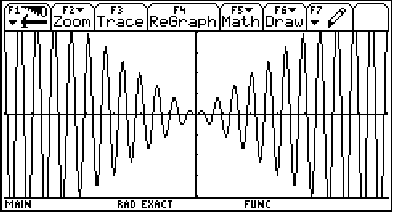
So, what does multiplying by the x do? Let's find out by graphing the whole thing!
f(x) = x*sin(10x)

(graphing window: x on [-7,7], y on [-4,4])